See subject performance
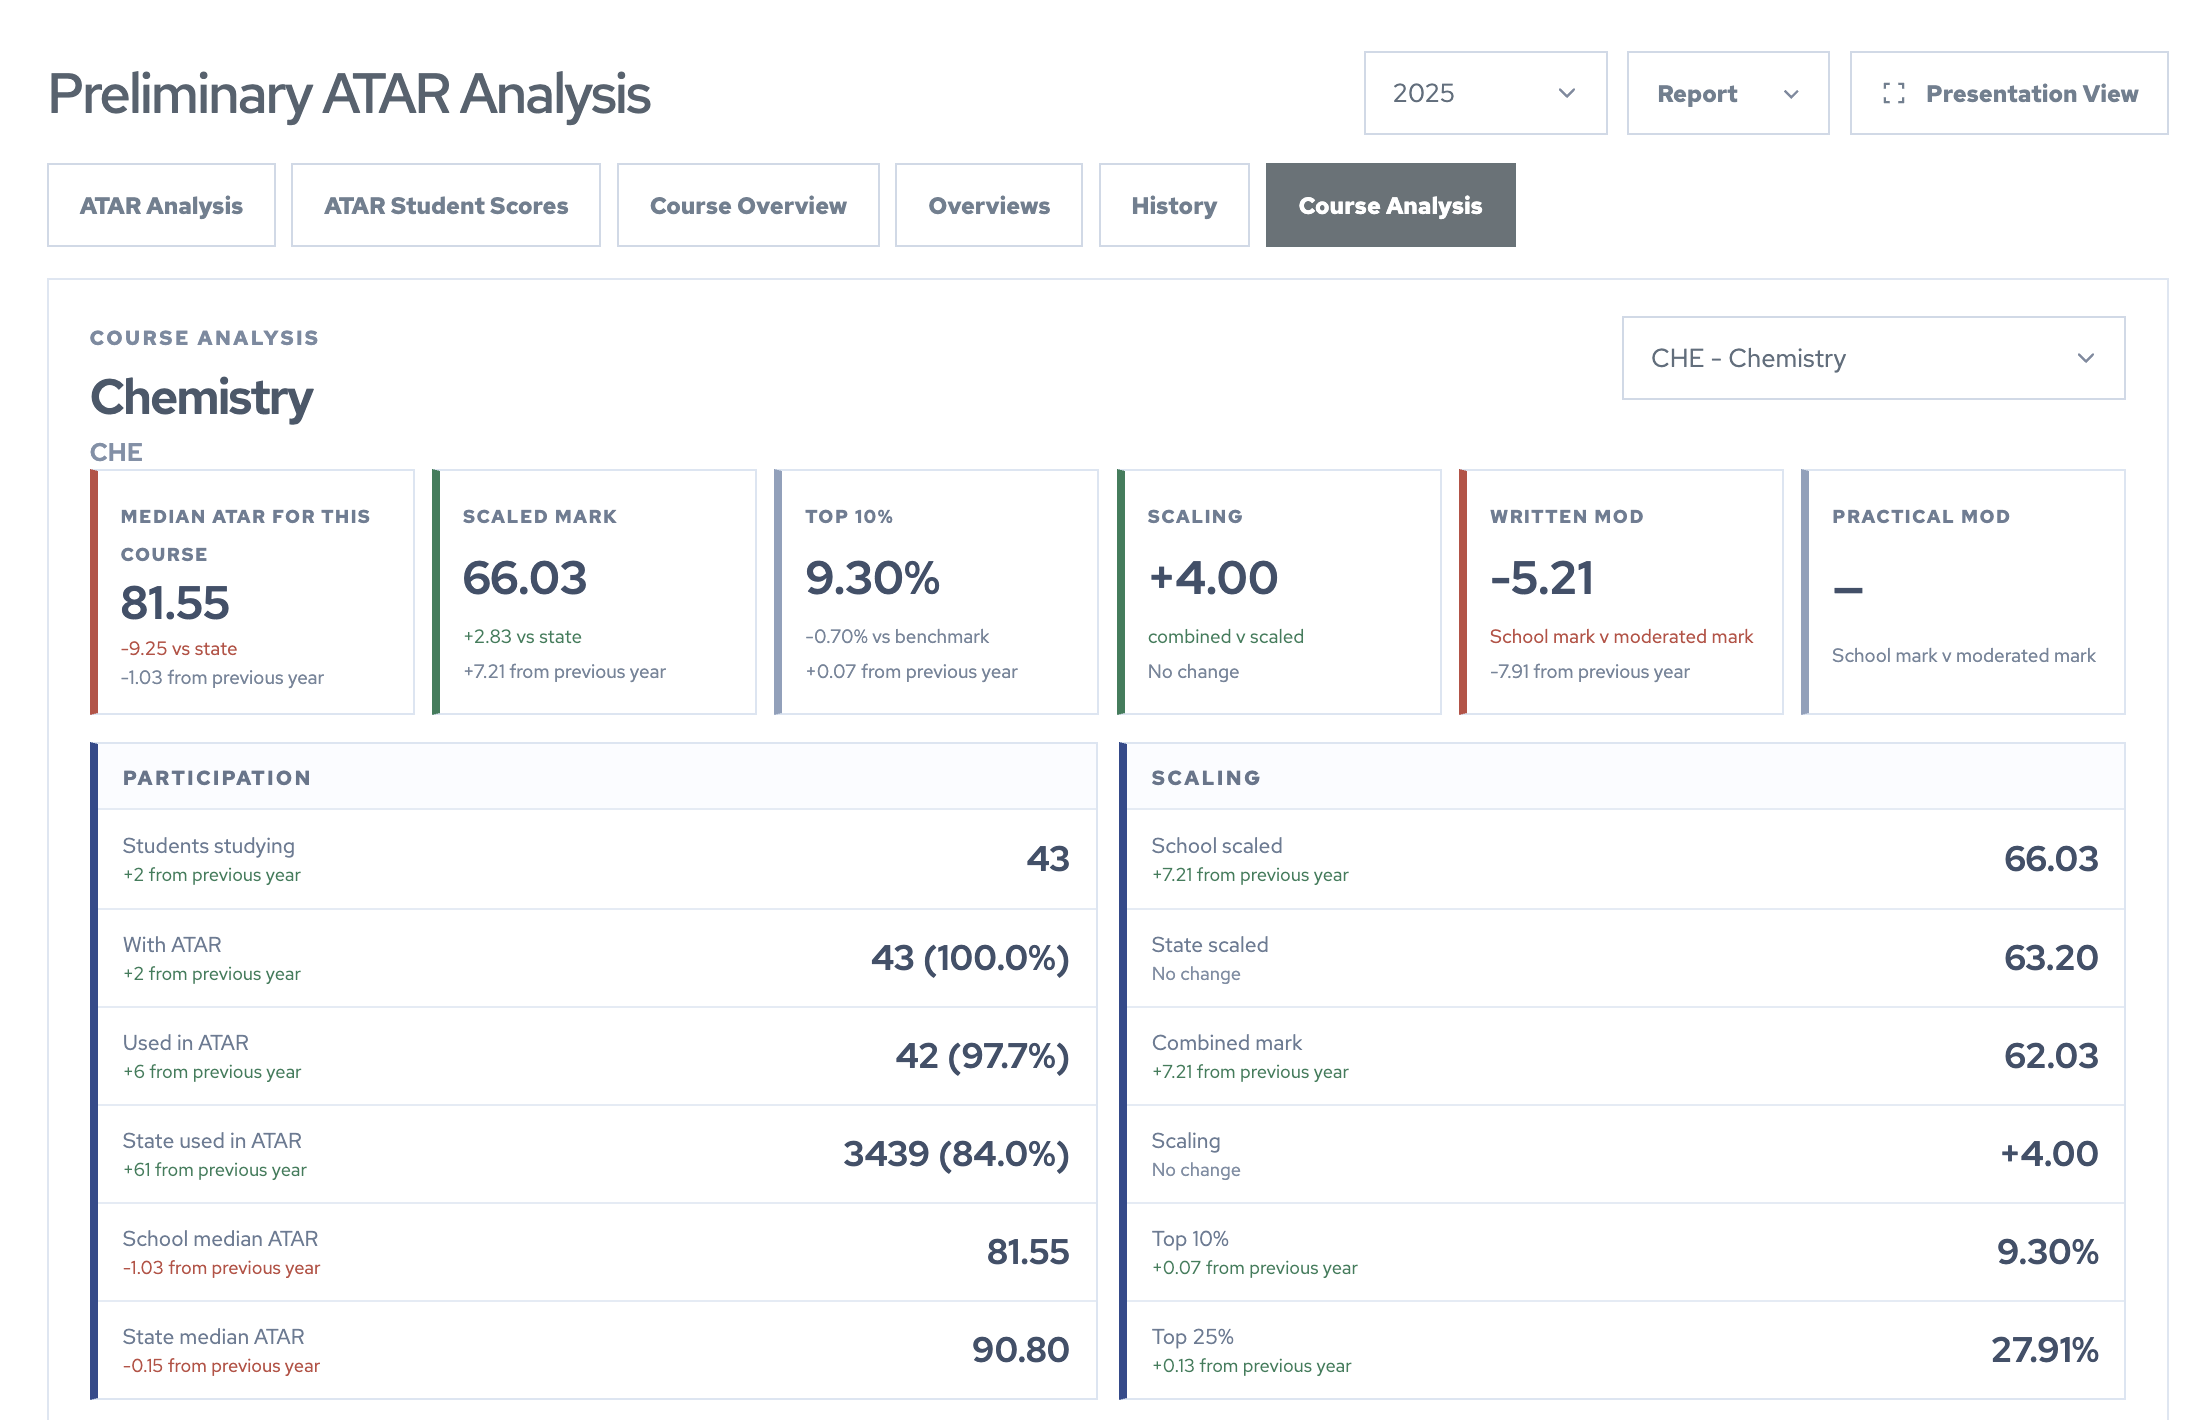
Review course outcomes, participation, distributions and school-versus-examination patterns.
Turn TISC results into clear insight about subjects, cohorts and school performance.
SchoolLens helps principals, deputies and academic leaders understand what happened, identify the patterns behind the results and carry evidence into future planning.
ATAR and TISC datasets contain evidence about subject performance, cohort movement, school versus examination results and longer-term trends. SchoolLens makes that evidence easier to explore.
Review course outcomes, participation, distributions and school-versus-examination patterns.
Explore student groups, rankings and achievement patterns across the completed cohort.
Use historical evidence to support leadership discussion, review and school improvement priorities.
Move from a completed results dataset to clear visual analysis in five practical steps.
Import the school's completed ATAR results dataset.
Review student, course and result information.
Investigate subjects, cohorts, scores and distributions.
Examine school, examination, state and historical trends.
Use visual summaries in leadership conversations.
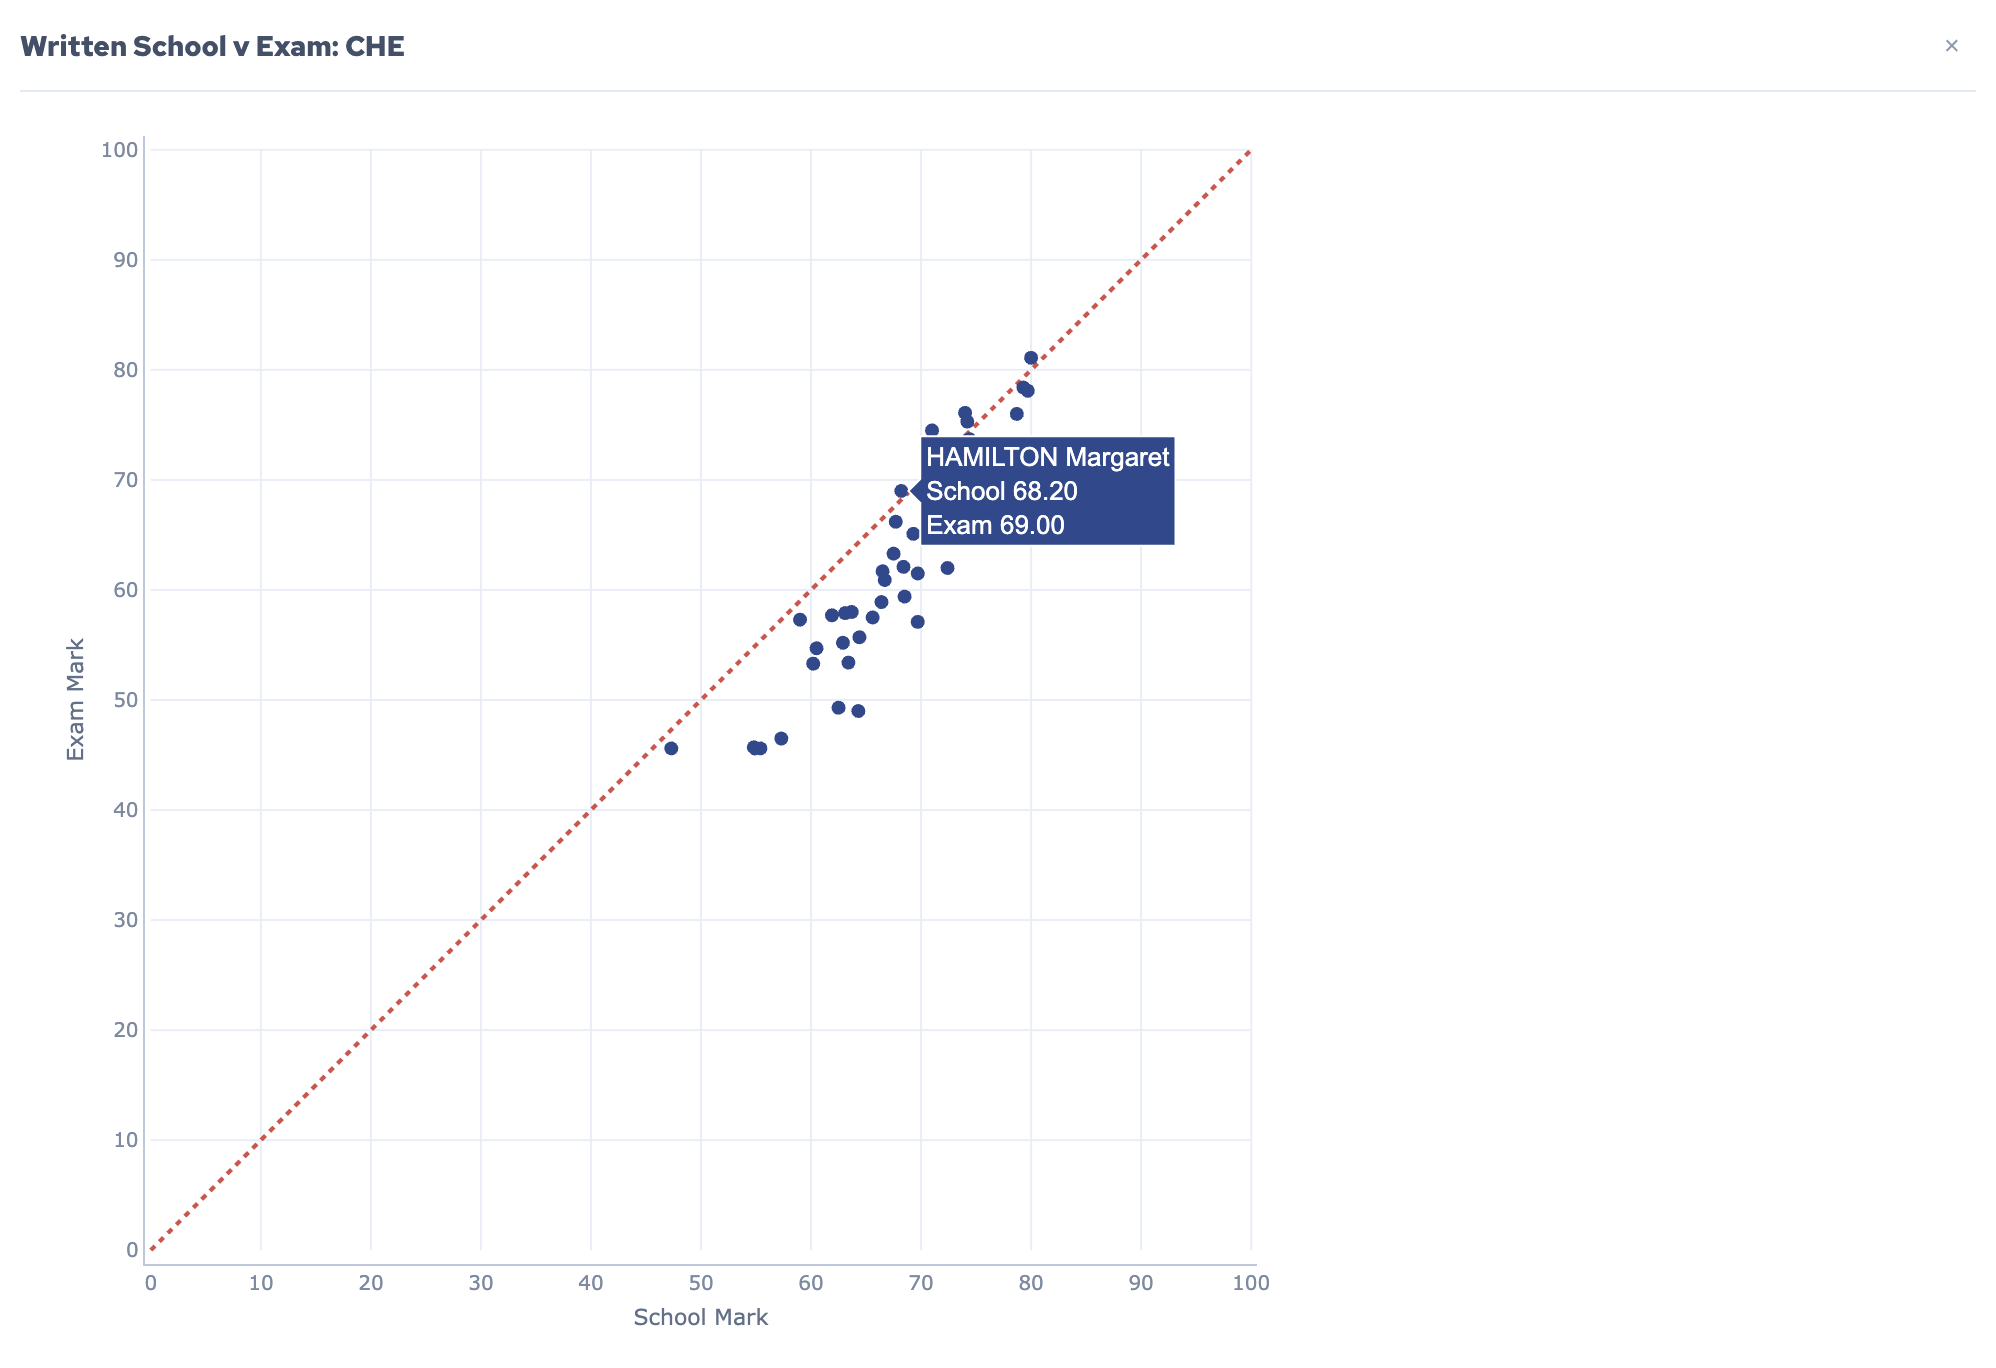
Move between whole-school trends and the detail needed to understand individual subjects, students and outcomes.
SchoolLens is a locally installed desktop application. ATAR and TISC data is processed on the school's computer rather than uploaded to an external analytics platform.
SchoolLens analyses school-held ATAR and TISC data to reveal student, subject, cohort and historical performance patterns.
No. SchoolLens performs analysis locally on the school's computer without uploading the dataset to an external platform.
Yes. SchoolLens helps schools investigate the relationship between written school results and examination performance.
Yes. SchoolLens supports historical trend analysis when the relevant data is available.
Yes. SchoolLens supports whole-school summaries alongside course and student-level detail.
Yes. SchoolLens provides visual summaries designed for leadership, planning and board-level conversations.
Book a demonstration to explore subject performance, cohort analysis and leadership-ready reporting for your school.
Request a SchoolLens Demonstration